Volatility Indices and VIX
Volatility as a measure of expected or realised deviation in asset returns over a specified period is thoroughly studied in the financial literature. Investors with long market exposure use volatility as a risk gauge, fearing periods of high volatility, since they are historically associated with sudden drops in returns.
Historical volatility
is a measure of past volatility and despite being conceptually simple and easy
to compute, it doesn’t have explanatory power on future volatility. We need to
use current market information to infer market expectations of future
volatility. Financial models can come to rescue.
Financial models attempt to predict future volatility based on the current market’s knowledge/data. In the options market, products such as call/put options allow one to buy/sell a stock on some expiration date \(T\) in the future (measured in years) at some price \(K\) called the strike price. Since stock price at expiration may deviate significantly from the strike price during periods of high volatility, the option writer charges a high “volatility premium” to compensate for the risk they take. Hence, option prices are an increasing function of volatility and this monotonic relation is given by the Black-Scholes formula. Since we have access to option prices, we can infer current volatility for the near-term future up to the expiration time \(T\) of the options. This measure of volatility is the implied volatility.
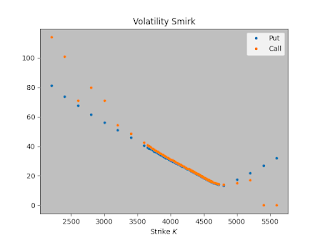
Under the model assumptions of Black-Scholes, all option prices regardless of the strike price \(K\) should produce the same implied volatility. However, after the 1987 stock market crash, implied volatility was no longer assumed to be independent of the strike price K, with OTM (out-of-the-money) strikes having higher implied volatility.
 |
| Volatility Smirk for the S&P500 recorded on 2/2/2022. |
A more robust volatility measure would be independent of model parameters such as strike price. Such measure for the S&P500 was introduced by CBOE, the new VIX index, which uses put and call prices from a wide range of strikes, with few model assumptions on the behaviour of volatility. It models volatility as a time dependent random process, with the volatility index defined as the expected average volatility over a period up to the expiration of the options, set to 1 month for the VIX.
Unlike the Black Scholes model, which assumes a constant
volatility level \sigma until expiration, the VIX index loosens this assumption
by allowing volatility \(\sigma_t\) to be a random process and considering the mean
square of that process instead. The mathematical formulation for the VIX index
is therefore,
$$ \left(\frac{\text{VIX}}{100}\right)^2 = \mathbb{E}\left( \frac{\int_0^T \sigma_t^2 dt}{T} \right). $$
The expectation E denotes the current market expectation of
the varying volatility levels sigma_t. The factor 100 is simply a convenient
scale factor and has no theoretical basis.
Deriving the VIX formula requires the solution of geometric Brownian motion and can be rather technical. However, the formula itself is rather simple and fairly easy to compute. As defined in CBOE’swhitepaper,
$$ \left(\frac{\text{VIX}}{100}\right)^2 = \frac{2e^{rT}}{T} \sum_i \frac{\Delta K_i}{K_i^2} Q(K_i) - \frac{1}{T} \left(\frac{F}{K_0}-1\right)^2, \text{ where } $$
- \(r\) is the risk-free interest rate to expiration,
- \(T\) is the expiration time; commonly set to \(30\) days or \(1/12\) of a year,
- \(F\) is the forward price of the S&P500,
- \(K_0\) is the first strike below \(F\) that is available in the options market,
- \(K_i\) is an increasing sequence of all the strike prices of OTM options; so, strikes above \(K_0\) correspond to call options and strikes below \(K_0\) correspond to put options,
- \(\Delta K_i\) is half of the distance between strikes on either side of \(K_i\),
- \(Q(K)\) is the option price for strike \(K\).
The second term in the formula is merely a correction term
that tends to be negligible, since there are many “near-the-money” options. The
first term is a linear combination of option prices across the strike spectrum.
In the following plot, the call and put prices with \(30\) days until expiration
are plotted, along with the option prices \(Q(K)\) that are used (with \(F \approx K_0 = 4550\)) in the VIX calculation and the summands of the VIX formula. Summing
all the terms in magenta and taking the square root, gives us the VIX index for
that day (2/2/2022) which was \(21\).
 |
| Option prices and summands of the VIX formula (in magenta) recorded on 2/2/2022. |
The \(\Delta K/K^2\) weights are higher when strikes are low and sparse. Therefore, deep OTM puts have a considerable impact on the calculation of the VIX. In fact, under this strike spectrum, the deep OTM puts have a weight that is around \(100\) times bigger than the weights of near-the-money options, with the former having considerably lower trading volumes and therefore being more uncertain estimates. To illustrate their effect, consider changing the prices of only the deepest \(5\) OTM puts, from their current prices (\(0.1\)-\(1\)) to \(2\). Such a change would increase the VIX index by \(1.2\) units to \(22.2\), a considerable change given that the VIX mostly takes values in the range of \(15\) to \(20\).
To make matters worse, there is an incentive for market manipulation, when VIX futures approach expiration. To increase the VIX value at expiration, one has to aggressively buy OTM options at a high price; deep OTM puts have the strongest effect. It is possible to influence the prices of OTM options because the trading volumes are very low. There is as Griffin and Shams have illustrated, there is a spike in the trading volumes of OTM options at \(30\) days to expiration and barely no change in ITM (in-the-money) trading, which does not influence the VIX.
 |
| Spike in trading volume of OTM options \(30\) days before expiration. Figure taken from Griffin and Shams. |
According to a letter from “an anonymous whistleblower who has held senior positions at some of the largest investment firms in the world”, the profits from this arbitrage are in the billions. Despite its criticisms, the VIX index remains one of the most widely used measure of market volatility. Many other benchmark indices around the world apply the VIX formula (VDAX-NEW, VSTOXX, VXN, VFTSE to name a few) highlighting its success as a volatility measure and a hedging strategy (through VIX futures) against it.


Comments
Post a Comment